
Boost Your Solar Panel Savings: Real 7kW Auckland Numbers
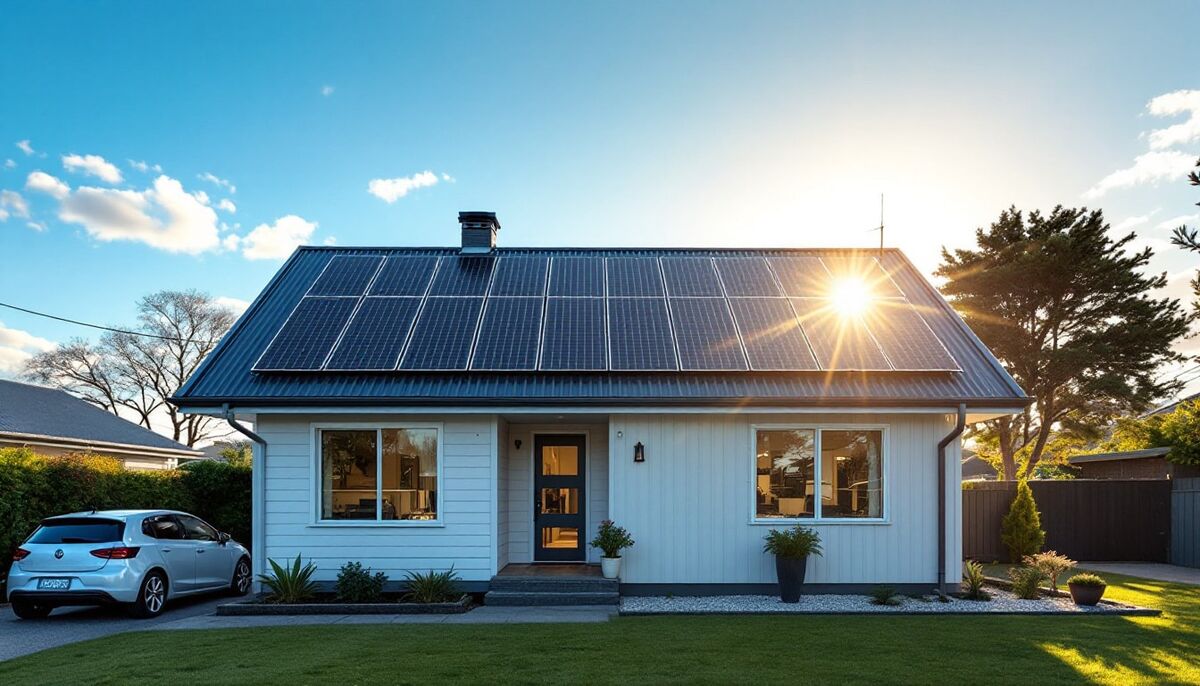
$83.16. That is what one Auckland household got back from its 7kW solar system in August 2026, the darkest stretch of the year, with short days and plenty of cloud. We pulled the numbers straight from their monitoring app and their power bill, so every figure below is real rather than a brochure promise.
If you are wondering what solar panel savings look like for a normal Kiwi home, this is a good place to start. We compare winter with summer, solar used at home with solar sent to the grid, and paid hours with free hours, then show how our 7kW home solar panel system fits in.
Used at Home vs Sent to the Grid: Where the Savings Come From
Every kilowatt hour your panels make goes one of two ways. It either powers something in the house right now, or it flows out to the grid and earns a buy-back credit. Those two paths are worth very different amounts, and that gap drives almost everything about solar panel savings.
In August, the panels on this Auckland roof produced 596.26 kWh. The app split that into 170.89 kWh used inside the home (29%) and 425.37 kWh exported (71%).
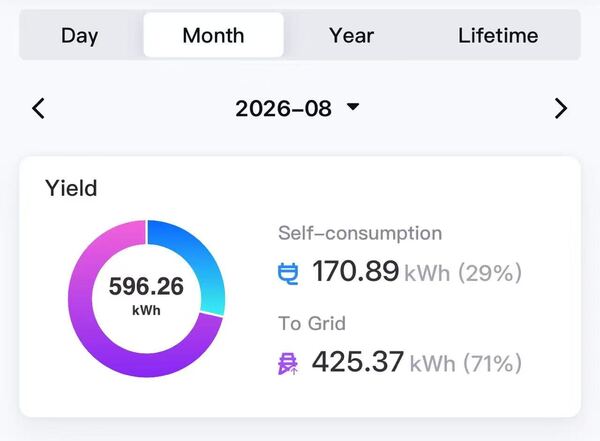
The household pays 28.75 cents per kWh (GST included) for power it buys, and gets 8 cents per kWh for power it sells. Put those rates against the app data and August's solar panel savings look like this:
| August 2026 | Value |
|---|---|
| Used at home, 170.89 kWh | $49.13 |
| Exported, 425.37 kWh | $34.03 |
| Total benefit | $83.16 |
Notice the imbalance. Less than a third of the solar stayed in the house, yet it earned more than half of the money. Each unit used at home is worth roughly three and a half times a unit sold back, which is why self-use matters so much for solar panel savings.
These figures are the bill benefit on the same plan with and without solar. They do not include the cost of buying, financing or maintaining the system.
Power Bill With Solar vs Without: What the Invoice Showed
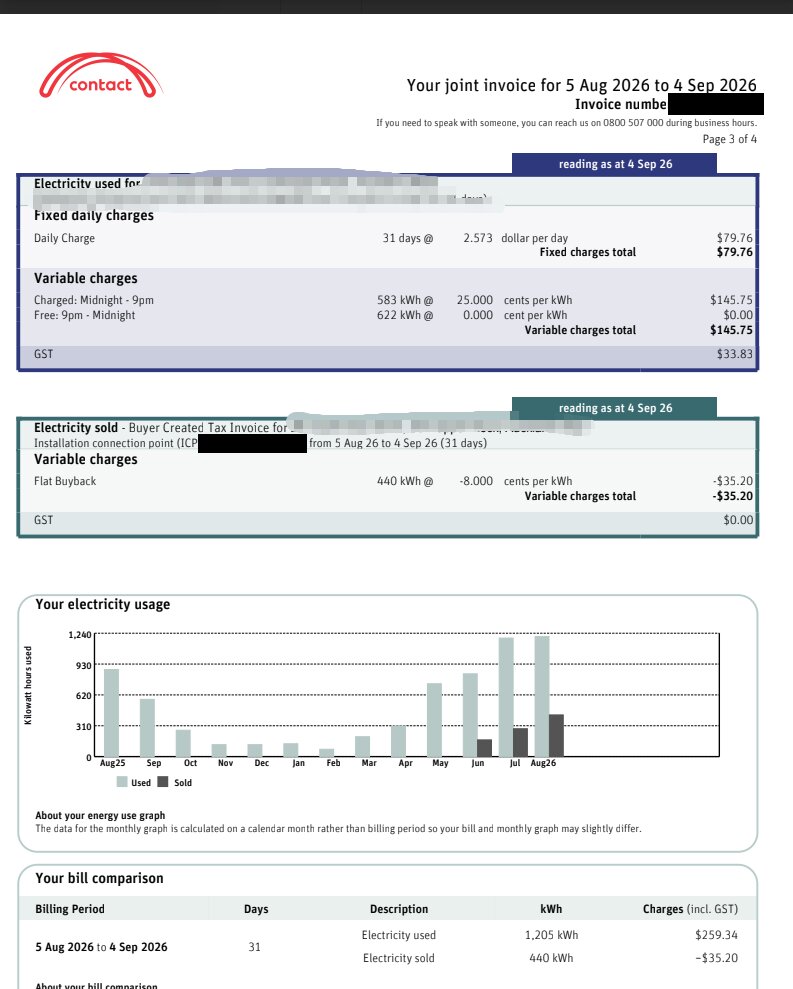
App numbers are useful, but most people trust the bill. Here is the electricity page from this household's invoice for 5 August to 4 September 2026. We have blacked out the account details, ICP number and invoice number.
| Bill item | Amount |
|---|---|
| Power used, incl. daily charge | $259.34 |
| Solar buyback credit | -$35.20 |
| Net electricity cost | $224.14 |
A few things are worth knowing when you read a bill like this. The daily fixed charge, about $2.96 a day including GST, never goes away with solar. Gas and any carried balances are left out of the table above.
The bill period and the calendar month also do not line up. The invoice counts 440 kWh sold, while the app counts 425.37 kWh for August, so the two sets of numbers should be read side by side rather than added together.
The bill only shows the export credit. The bigger part of your solar panel savings, power the family never had to buy because the panels supplied it, is invisible on the invoice, and that is why many owners underestimate what their system earns.
Paid Hours vs Free Hours: Why Timing Beats Sunshine
This household is on a plan with free power from 9pm to midnight. Of the 1,205 kWh they imported in the bill period, 622 kWh fell in that free window. That is about 52% of their usage costing nothing, which is great for the bill but changes how solar should be used.
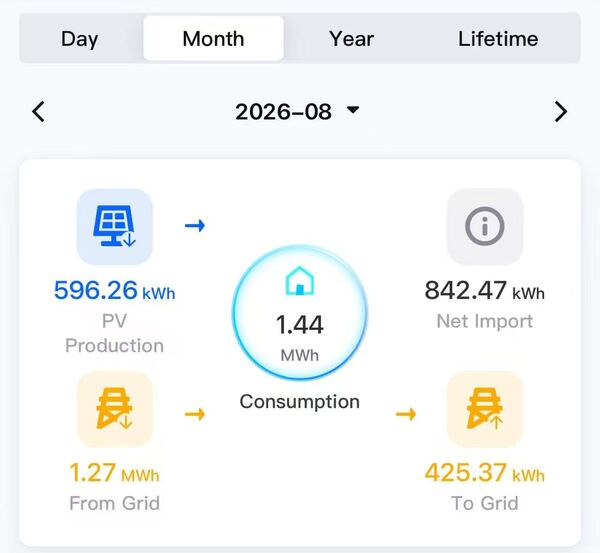
The app shows the home used 1.44 MWh in August, and solar covered about 12% of it directly. There is room to grow that share, but only by moving the right loads. Here is how each option compares for one kWh of load moved onto surplus daytime solar:
| Load moved from | Effect per kWh |
|---|---|
| Paid hours to solar | +20.75c |
| Free 9pm window to solar | -8c |
| Already on solar | No change |
Moving 100 kWh a month out of paid hours and onto the panels would add about $20.75 to monthly solar panel savings. Moving the same 100 kWh out of the free window would actually cost $8, because that power was free anyway and you lose the export credit.
Good loads to run on midday sun:
- Washing machine and dryer cycles that currently run in the paid evening
- Dishwasher loads you can start before leaving for work, set on a timer
- Hot water heating or EV charging, if they are not already in the free window
Loads best left where they are:
- Anything already running free between 9pm and midnight
- Appliances you need at a set time, where shifting them would be a hassle
Winter vs Summer: Solar Panel Savings Through the Year
August is close to the worst month for solar in Auckland. So what happens when the long days arrive? Government modelling for Auckland from EECA puts December and January output at roughly 1.6 to 2.0 times August output for a north-facing roof at a 15 to 30 degree pitch.
Apply that to this roof's real August figure and summer lands somewhere around 960 to 1,200 kWh a month. We have not surveyed the roof's exact orientation or shading, so treat this as a sensible estimate rather than a forecast. Using the same rates as the bill:
| Summer scenario | Self-use | Per month |
|---|---|---|
| Same as August | 171 kWh | $112-$131 |
| 30% used at home | 288-360 kWh | $137-$171 |
| 50% used at home | 480-600 kWh | $176-$221 |
Compared with $83 in winter, summer solar panel savings could be roughly 35% to 165% more, depending on how the extra power gets used. The top rows only happen if the family already has paid daytime usage to replace, not if they simply pull loads out of the free window.
The lesson is simple. Doubling generation does not double savings on its own. If nobody is home to use it, most of the extra summer power earns 8 cents at the export rate instead of avoiding 28.75 cents of purchases.
Our 7kW Package vs a Typical Auckland Power Bill
A 7kW system is the size we recommend most often for a medium to large Auckland household. Our fixed price 7kW home solar package is designed for homes spending around $200 a month on power, which matches the bill in this case study closely.
| 7kW package | Details |
|---|---|
| Price, installed | NZ$10,899 |
| Panels | 16 x 440W |
| Inverter | 6kW hybrid, single phase |
| Suits a power bill of | About $200 a month |
| Warranties | 25yr PV, 10yr inverter |
| Workmanship | 5 years, in-house team |
The package includes design, installation by our own team, and the monitoring app you have seen in the screenshots above. Because the inverter is a hybrid, you can add a battery later without replacing it.
Package pricing covers single-storey homes with a metal roof pitched at 25 degrees or less, within 50km of Auckland CBD. Other roofs and locations are quoted individually, as the two projects below show.
Two Real 7kW Installs: Auckland vs Whangarei
Numbers from one house are a start. Here is how two other 7kW projects we installed compare, one right in Auckland and one further north.
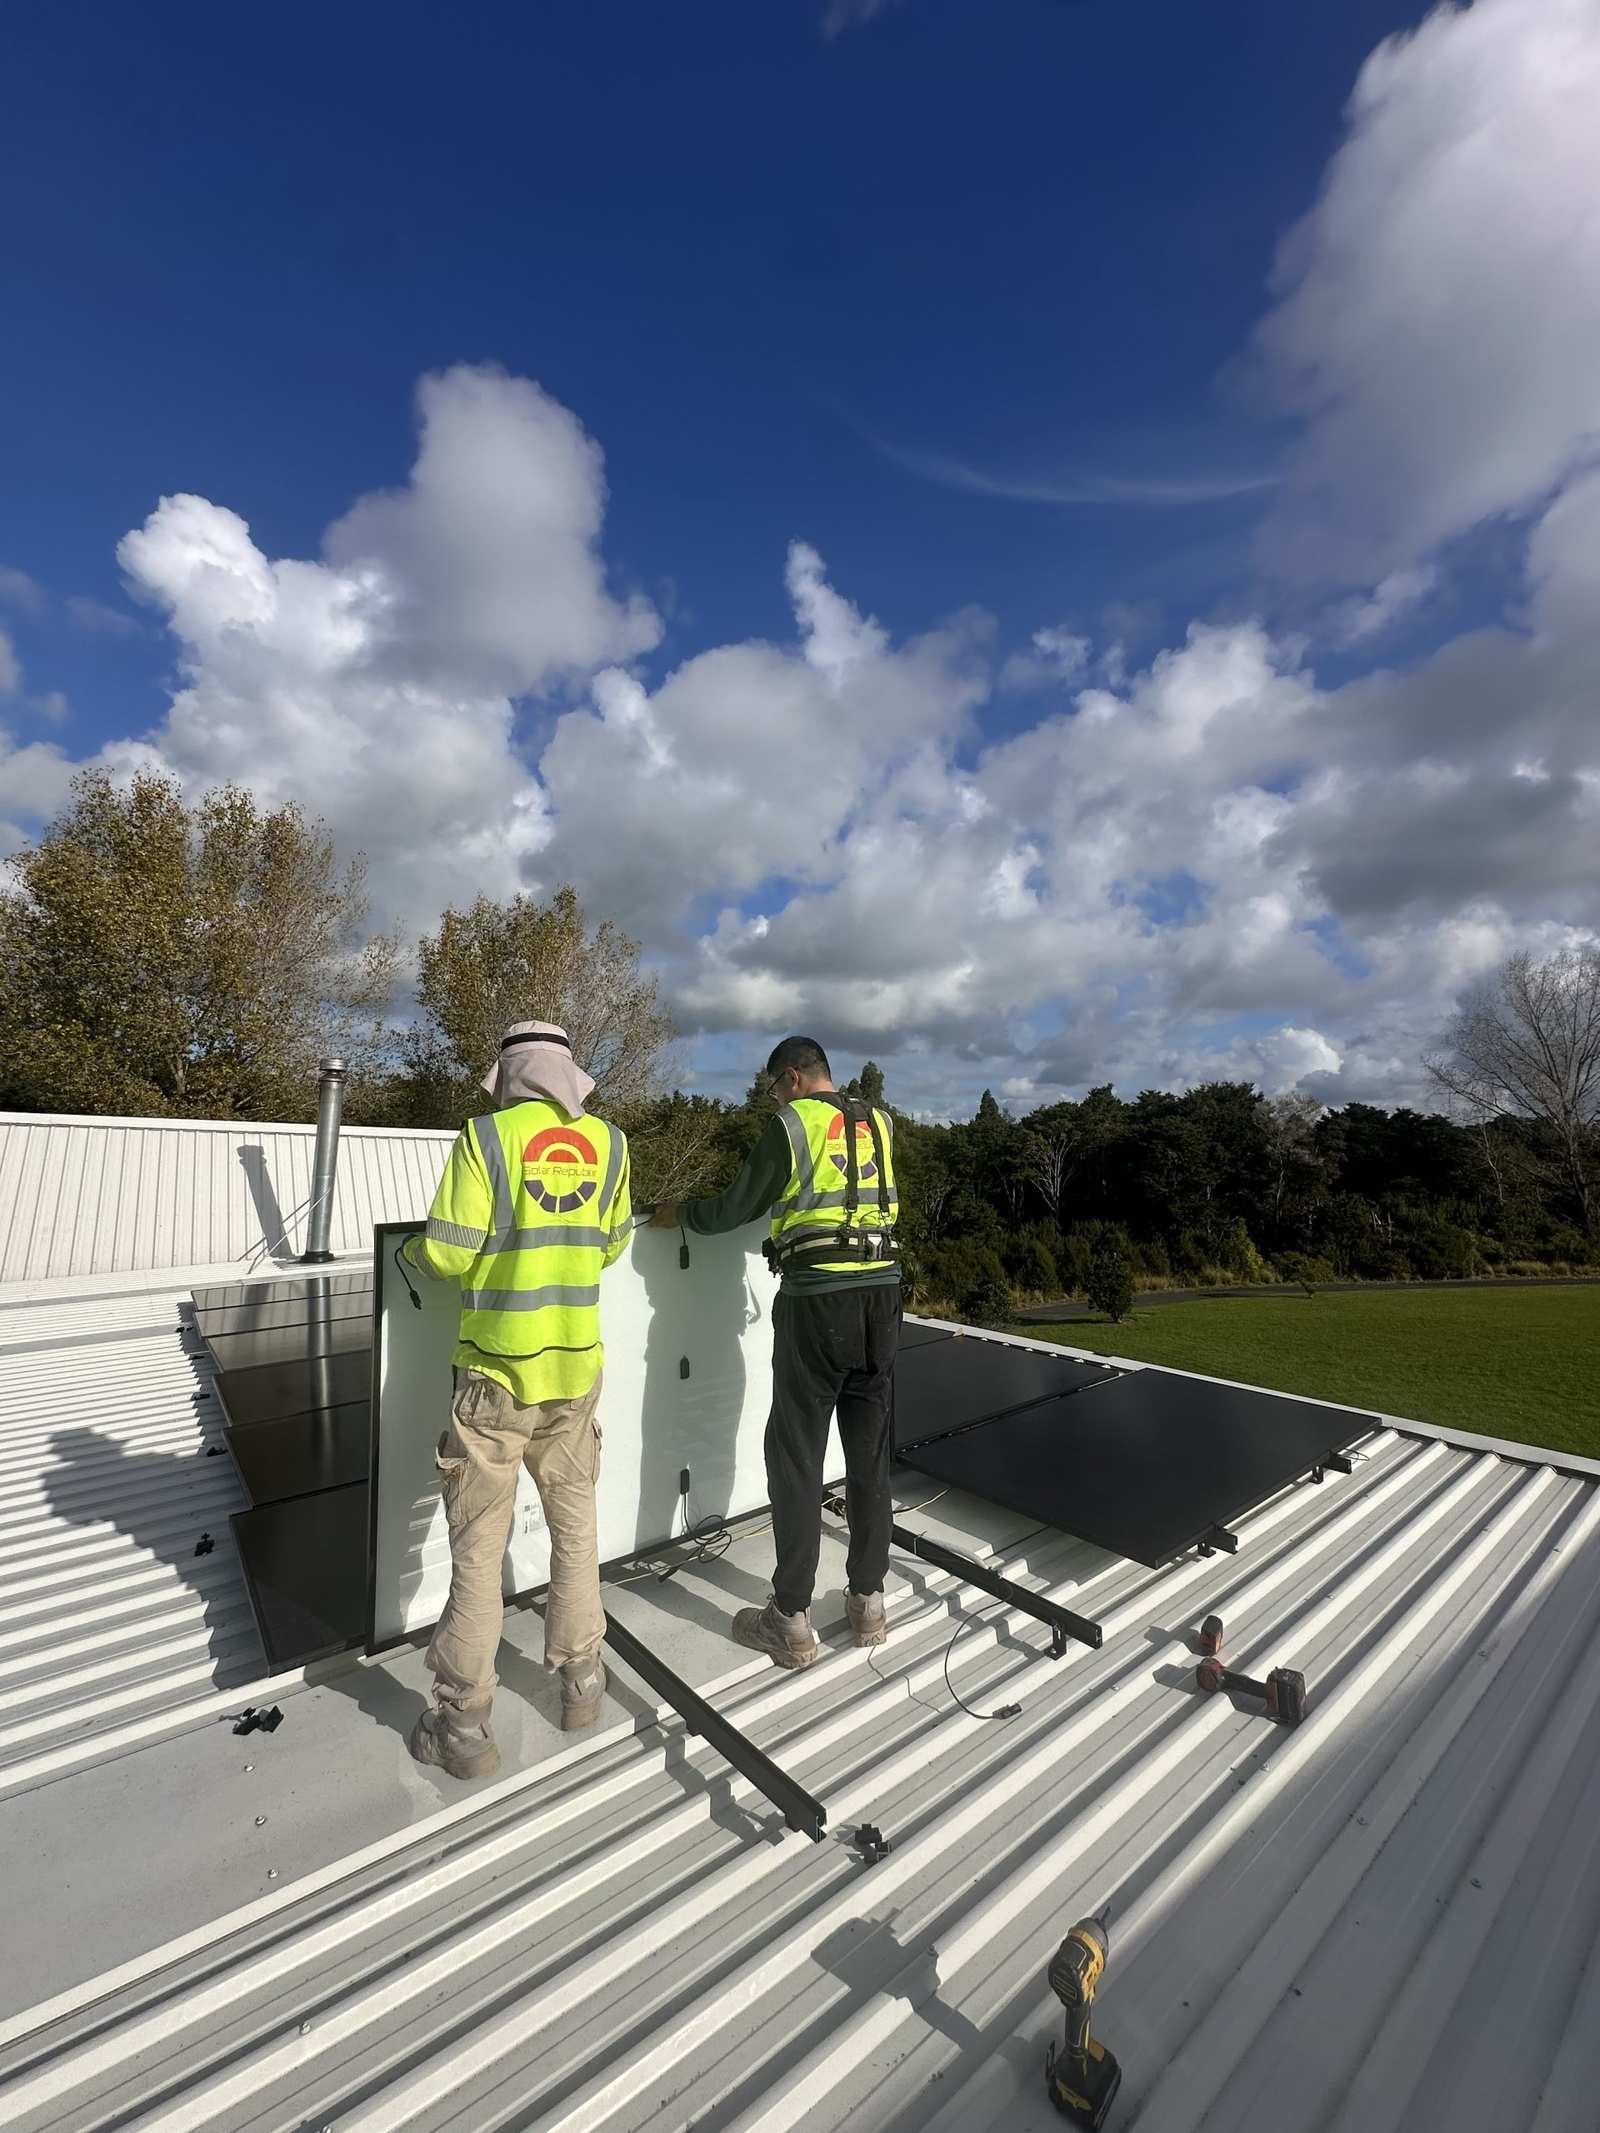
7kW home system on a Colorsteel roof, Auckland
| Installed | April 2026 |
| Panels | 14 x 510W |
| Battery | None, grid-tied |
| Modelled payback | Around 5 years |
This family wanted to get ahead of rising power prices without paying for a battery upfront. The design focuses on strong daytime generation to cut the bill immediately. See the Auckland 7kW project.
7kW three phase system on concrete tiles, Whangarei

| Installed | November 2025 |
| Panels | 14 x 500W |
| Supply | Three phase |
| Roof | Concrete tile |
This home started from our standard 7kW package and was upgraded for three phase power, a tile roof and the trip north. Three phase spreads heavy appliances more evenly and leaves room to expand later. See the Whangarei 7kW project.
Solar Now vs Waiting: Which Suits Your Home?
Solar is a strong fit for some households and a slower win for others. Here is an honest way to decide.
A 7kW system makes sense now if:
- Your power bill sits around $200 a month or more, excluding gas
- Someone is home during the day, or you can put laundry, dishes and hot water on timers
- You have a north, east or west facing roof with little shade
It may pay to plan a little more first if:
- Nearly all your usage already falls in a free or cheap night window
- The house sits empty all day and you cannot shift any loads
- Your roof is heavily shaded or due for replacement soon
If you land in the second group, solar panel savings are still possible. It usually means a smaller system, a different tariff, or a battery, and it is worth running the numbers before you buy. Our guide to 5kW vs 7kW vs 10kW packages can help you compare sizes.
Solar Panel Savings FAQ
How much can a 7kW system save in Auckland?
In this case study, a 7kW system delivered $83.16 of benefit in August, one of the weakest solar months. Summer estimates range from about $112 to $221 a month, depending on how much of the power the household uses directly.
Why is solar used at home worth more than exported solar?
Power used at home replaces electricity you would otherwise buy, which cost this household 28.75 cents per kWh. Exported power earns a buy-back rate, here 8 cents per kWh. Using more of your own solar is the fastest way to lift savings.
Will solar panels remove my daily fixed charge?
No. The daily charge, around $2.96 a day in this example, stays on your bill whether you have solar or not. Solar reduces the variable part of the bill, the energy you buy each month.
Do I need a battery to get good solar panel savings?
Not necessarily. Both 7kW projects above run without a battery and rely on daytime self-use plus export credits. A battery can raise savings when you use a lot of power in the evening, and our hybrid inverter lets you add one later.
How can I estimate savings for my own home?
Start with a recent power bill that shows your rates, buy-back price and any free hours. Our team uses that, plus your roof and daily routine, to model both winter and summer results before you commit.
Have questions about your own bill or roof? We are happy to walk through the numbers with you. Get in touch with our team and send a recent power bill, and we will show you what a 7kW system could realistically save.